开发者模式-标注
根据需要,有的图表中需要添加标注来进行提醒,我们也可以根据自定义函数来进行设置对图表上面的属性来进行标注或插入静态图片。标注和图片都在layout属性里:标注对应的属性为 annotations为对象数组,只需要将需要设置的坐标点进行传入即可,对应的标注文本内容为text;图片对应的属性为images也是对象数组。
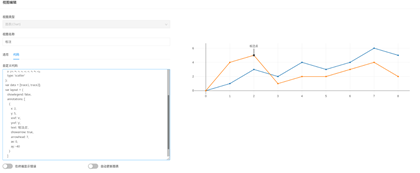
标注示例
// 传入参数: x, ys, element, scheme 和 Plotly。
// x:为x轴返回值数组。
// ys:为y轴返回值数组对象,如ys.field1等获取对应y轴返回值数组。
// element:为容器div对象。
// scheme:为样式对象,包括style,mode,bg,back,color属性。
// 调用:Plotly.plot(element, data, layout, config)。
// 示例和参考:http://dazdata.com/category/college/plotly/
var trace ={  x: [1, 2, 3],
  y: [1, 2, 3]};
var data=[trace];
var layout= {
  images: [
      {
        "source": "https://images.plot.ly/language-icons/api-home/python-logo.png",
        "xref": "paper",
        "yref": "paper",
        "x": -0.05,
        "y": 0.5,
        "sizex": 0.2,
        "sizey": 0.2,
        "xanchor": "right",
        "yanchor": "bottom"
      }],
xaxis: {
   title:"yhytest",
   side:"top",
  },
yaxis: {
   title:"yhytest",
    titlefont: {
      size: 16,
      color: 'rgb(107, 107, 107)'
    },
    tickfont: {
      size: 14,
      color: 'rgb(107, 107, 107)'
    }
  },
annotations: [{
    xref: 'paper',
    yref: 'paper',
    x: 0,
    xanchor: 'right',
    y: 0.4,
    yanchor: 'bottom',
    text: 'X axis label',
    showarrow: false
  }, {
    xref: 'paper',
    yref: 'paper',
    x: 1,
    xanchor: 'left',
    y: 0,
    yanchor: 'top',
    text: 'Y axis label',
    showarrow: false
  }]
}
Plotly.newPlot(element, data,layout)